USD
- The Fed left interest rates unchanged as expected at the last meeting, with virtually no change in its statement. The Dot Plot still shows three rate cuts for 2024 and the economic projections have been improved with higher growth and inflation and lower unemployment.
- The US CPI beat expectations for the third consecutive month, while the US PPI was in line with forecasts.
- U.S. NFP beat expectations across the board, although average hourly earnings were in line with forecasts.
- The US ISM Manufacturing PMI significantly exceeded expectations, as the price component continued to rise, while the US ISM Services PMI missed expectations, with the price index falling to a 4-year low.
- U.S. retail sales far exceeded expectations across the board, with positive revisions from previous figures.
- The market now expects a first rate cut in September.
JPY
- The BoJ finally ended the negative interest rate policy as planned at the last meeting by raising interest rates by 10 basis points, bringing the rate back to a target of between 0.00 and 0.10 %. Additionally, the central bank abandoned yield curve control and ETF purchases, while maintaining QE.
- The latest unemployment rate fell short of expectations, although it continues to hover around cycle lows.
- Japanese PMIs have further improved for both manufacturing and services measures, although the former remain in contraction territory.
- The latest Japanese salary data is in line with expectations.
- Tokyo’s CPI, considered a leading indicator of the national CPI, came in line with expectations.
- The market expects another rate hike from the BoJ this year, although the timing remains uncertain.
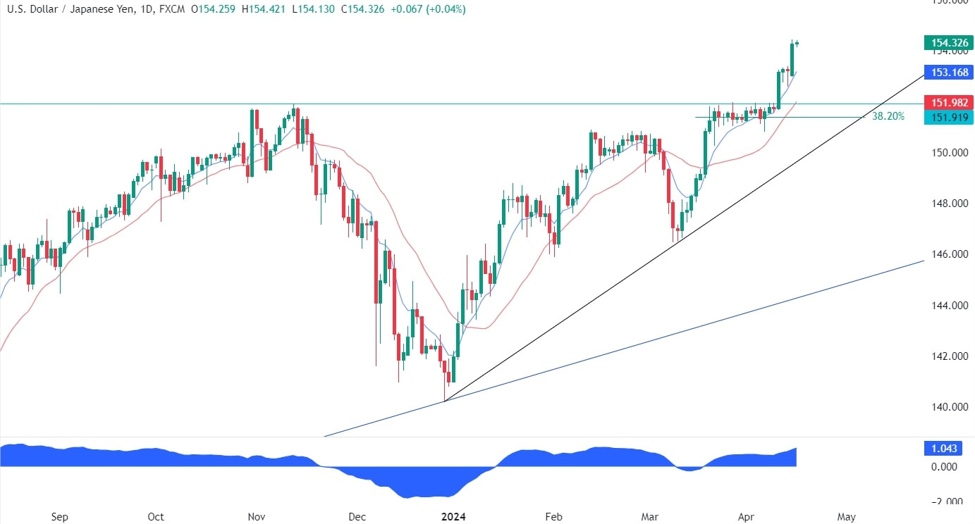
USDJPY Technical Analysis – Daily Time Frame
USDJPY Daily
On the daily chart, we can see that USDJPY finally broke out of consolidation following another hot US CPI report. This breakout opened the door to much higher prices with no real resistance in sight up to the 160.00 handle. From a risk management perspective, buyers will have a much better risk to reward setup around previous resistance turned support where one can also find the trendline confluence and Fibonacci retracement level of 38.2%. Sellers, on the other hand, will want to see the price move lower to invalidate the bullish setup and position themselves for a decline into the next major trendline around the 146.00 handle.
USDJPY Technical Analysis – 4 hour time frame
USDJPY 4 hours
On the 4-hour chart we can see that we have another trendline for buyers to rely on in the event of a pullback, where they will also find the 38.2% Fibonacci retracement level for the confluence. Sellers, on the other hand, will want to see the price decline to position below the 151.92 support zone with a better risk/reward ratio.
USDJPY Technical Analysis – 1 Hour Time Frame
USDJPY 1 hour
On the hourly chart, we can see that price has diverged with the MACD, which is usually a sign of weakening momentum, often followed by pullbacks or reversals. In this case, this could be a signal for a pullback into the trendline and the Fibonacci retracement level around the 152.50 level. Price will need to break below the most recent low at 153.87 to confirm the larger pullback, as sellers will likely pile in more aggressively to target the 152.50 level.
Events to come
On Thursday we will receive the latest figures for jobless claims in the United States, while on Friday we conclude the week with the Japanese CPI.
Watch the video below
cnbctv18-forexlive