USD
- The Fed left interest rates unchanged as expected at the last meeting, with virtually no change in its statement. The Dot Plot still shows three rate cuts for 2024 and the economic projections have been improved with higher growth and inflation and lower unemployment.
- The US CPI beat expectations for the third consecutive month, while the US PPI was in line with forecasts.
- U.S. NFP beat expectations across the board, although average hourly earnings were in line with forecasts.
- The US ISM Manufacturing PMI significantly exceeded expectations, as the price component continued to rise, while the US ISM Services PMI missed expectations, with the price index falling to a 4-year low.
- U.S. retail sales far exceeded expectations across the board, with positive revisions from previous figures.
- The market now expects a first rate cut in September.
GUJAT
- The Bank of Canada left interest rates unchanged at 5.00%, as expected, changing a line in the press release that indicated less concern about inflation and therefore the possibility of a cut in June if the trend remains intact.
- The latest Canadian CPI missed expectations across the board, with underlying inflation measures falling.
- On the labor market side, the latest report fell short of expectations across the board, although we did see a slight uptick in wage growth, a phenomenon the Bank of Canada is closely monitoring.
- The Canadian manufacturing PMI improved slightly in March, while the services PMI weakened further. Both measures remain in contraction territory.
- The market expects a first rate cut in June.
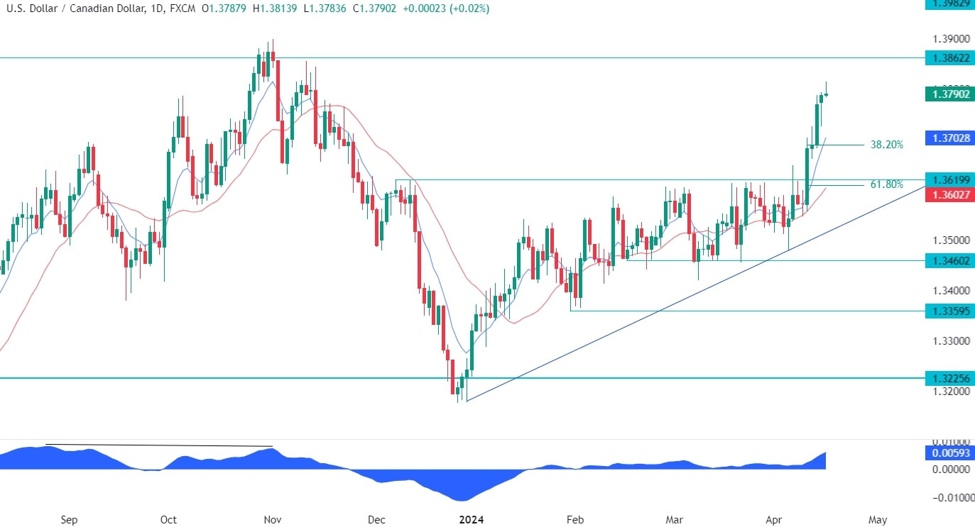
USDCAD Technical Analysis – Daily Timeline
USDCAD Daily
On the daily chart, we can see that USDCAD broke the key resistance at 1.3620 following another hot US CPI report and extended the rally to the 1.38 handle. The price has been a bit too high, as shown by the distance from the blue 8 moving average. In such cases, we can usually see a pullback towards the moving average or some consolidation before the next move. In this case, a pullback would also coincide with the 38.2% Fibonacci retracement level, where buyers will likely step in to position themselves for a rally to a new cycle high.
USDCAD Technical Analysis – 4 Hour Timeframe
USDCAD 4 hours
On the 4-hour chart we can see that we have a minor trendline defining the current bullish momentum with the red 21 moving average adding further support. Buyers will likely rely on the trendline to position themselves for a further rally to new highs. Sellers, on the other hand, will want to see the price decline to position themselves for a decline into the next trendline around the 1.3660 level where there will also be the 38.2% Fibonacci retracement level adding a additional support.
USDCAD Technical Analysis – 1 Hour Timeframe
USDCAD 1 hour
On the hourly chart we can see that price has diverged with the MACD, which is usually a sign of weakening often followed by pullbacks or reversals. In this case, this could be the signal for a pullback into the minor trendline where we can also find the 61.8% Fibonacci retracement level for the confluence. A downward break, however, would confirm a reversal and trigger a fall into the base of the divergent formation around the 1.3660 level.
Events to come
Today we will see the Canadian CPI, while on Thursday we will have the latest US jobless claims figures.
cnbctv18-forexlive