The main stock indices continue their decline with the NASDAQ index down almost 1%.
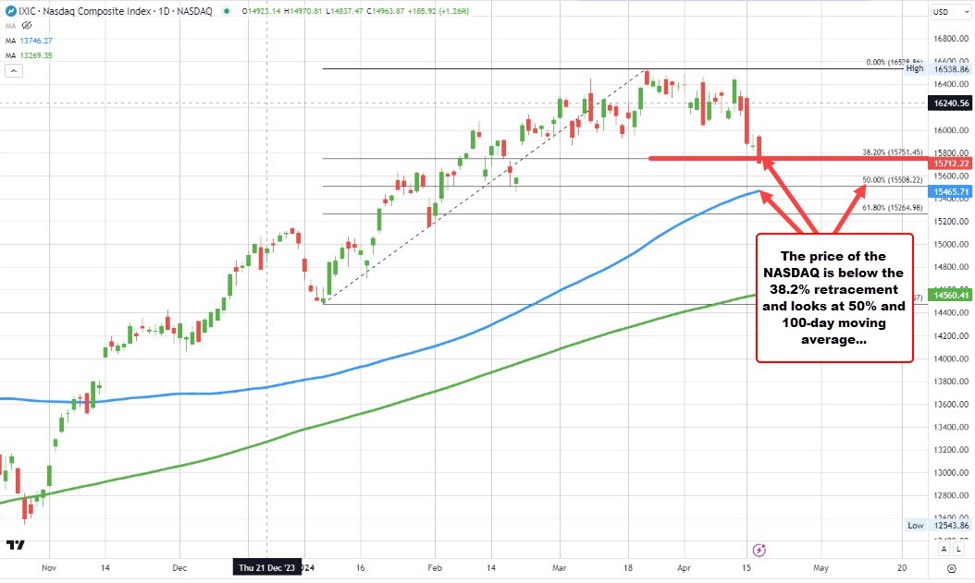
The NASDAQ Index is below the 38.2% retracement
Looking at the daily chart of the NASDAQ Index, it is now below the 30.2% retracement of the rise from the January low to the January high. This level stands at 15751.45. The same below this level allows sellers to maintain control at least in the short term.
The 50% midpoint of the same 2024 range is at 15,508.22. The 100-day moving average is 15,465.72. These levels are the next targets for the daily chart.
Looking at the S&P Index, it also fell below its 38.2% retracement of the 2024 trading range at 5,042.24. Its 50% midpoint is at 4973.48. The 100-day moving average is down at 4926.26. Both are targets there.
S&P is below the 38.2% retracement
cnbctv18-forexlive