Last Friday, the Nasdaq Composite Index sold off at the close as we reduced risk flows across the board due to news of imminent Iranian retaliation. Over the weekend, Iran launched its operation with drones and missiles against Israel, but almost all of them were intercepted and there were no casualties. Ultimately, Iran declared the operation considered complete and we received reports of a general de-escalation, with the United States telling Israel it would not support retaliation. We may see some positive risk sentiment and likely a discrepancy with the economic data that will then be the focus.
Nasdaq Composite Technical Analysis – Daily Timeline
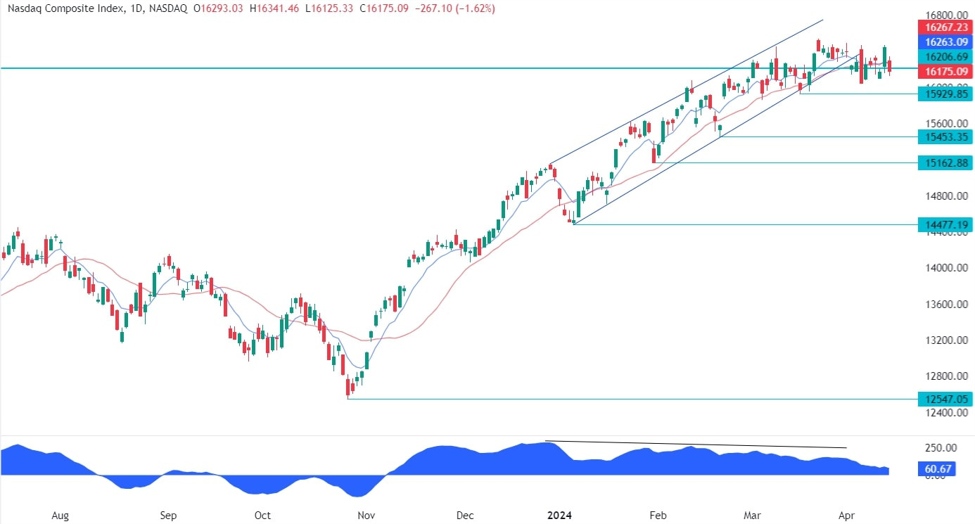
Nasdaq Composite Daily
On the daily chart we can see that the Nasdaq Composite has been consolidating around the 16206 level for over a month and despite some bearish catalysts like another rising US CPI and the absence of risk, the price has not been able to reach a new low. This could be a sign that the market is more likely to experience an upside breakout and print new all-time highs, although we will need to see a breakout first to confirm this.
Nasdaq Composite Technical Analysis – 4 Hour Timeframe
Nasdaq Composite 4 hours
On the 4-hour chart, we can see that the price is between the support of 16090 and the resistance of 16480. Market participants continue to play the range by buying at support and selling at resistance, in waiting for a breakout on either side to give an indication of the next big move.
Nasdaq Composite Technical Analysis – 1 Hour Timeframe
Nasdaq Composite 1 hour
On the hourly chart, we can take a closer look at the price action in the range inside the blue box with no clear signal for the next move until we get a breakout on either side.
Events to come
This week is a bit empty on the data front with only two notable reports. Today we have the retail sales data while on Thursday we will get the latest US jobless claims numbers.
cnbctv18-forexlive