USD
- The Fed left interest rates unchanged as expected at the last meeting, with virtually no change in its statement. The Dot Plot still shows three rate cuts for 2024 and the economic projections have been improved with higher growth and inflation and lower unemployment.
- The US CPI beat expectations for the third consecutive month, while the US PPI was in line with forecasts.
- U.S. NFP beat expectations across the board, although average hourly earnings were in line with forecasts.
- The US ISM Manufacturing PMI significantly exceeded expectations, as the price component continued to rise, while the US ISM Services PMI missed expectations, with the price index falling to a 4-year low.
- U.S. retail sales far exceeded expectations across the board, with positive revisions from previous figures.
- The market now expects a first rate cut in September.
GBP
- The BoE left interest rates unchanged as expected, but Haskel and Mann this time voted for a hold rather than an increase.
- The jobs report fell short of expectations with the unemployment rate rising sharply although wage growth increased.
- UK CPI beat expectations with services inflation remaining stable, continuing to support the BoE’s patient stance.
- The latest UK PMIs showed that the Services PMI was slightly below expectations and the Manufacturing PMI was above expectations.
- UK retail sales fell short of expectations across the board.
- The market expects a first rate cut in August.
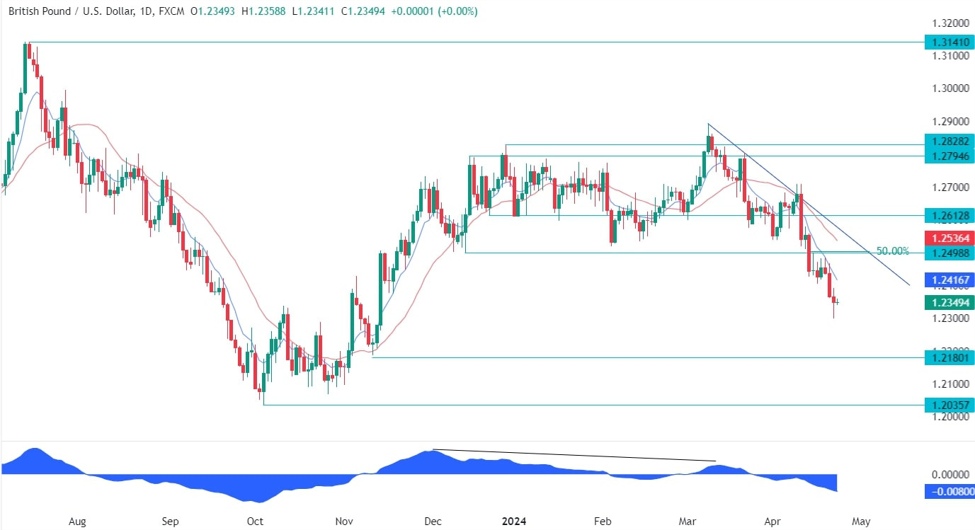
GBPUSD Technical Analysis – Daily Timeline
GBPUSD Daily
On the daily chart we can see that GBPUSD moved back into the broken support, turned resistance around the 1.25 handle and extended the sell to the 1.23 handle where we got a small bounce. We can notice that the price is once again a bit excessive, as shown by the distance from the blue moving average 8. In such cases, we can usually see a pullback towards the moving average or some consolidation before the next move.
GBPUSD Technical Analysis – 4 Hour Timeframe
GBPUSD 4 hours
On the 4-hour chart, we can see that price is diverging with the MACD, which is usually a sign of weakening momentum, often followed by pullbacks or reversals. In this case, this could be the signal for a pullback into the minor black trendline where we can also find the confluence of the Fibonacci retracement levels and the red 21 moving average. This is where we can We expect sellers to step in with defined risk above the trendline to position themselves for a fall to new lows. Buyers, on the other hand, will want to see the price move higher to invalidate the bearish setup and position for a rally towards the major trendline around the 1.25 handle.
GBPUSD Technical Analysis – 1 Hour Timeframe
GBPUSD 1 hour
On the hourly chart, we can take a closer look at the bearish pattern around the 1.24 handle. Watch out for the UK and US PMIs today as they will be market-moving events and will likely trigger the patterns described.
Events to come
Today we get the UK and US Flash PMIs. On Thursday we will see the latest US jobless claims figures, while on Friday we conclude the week with the US PCE report.
cnbctv18-forexlive