USD
- The Fed left interest rates unchanged as expected at the last meeting, with virtually no change in its statement. The Dot Plot still shows three rate cuts for 2024 and the economic projections have been improved with higher growth and inflation and lower unemployment.
- The US CPI beat expectations for the third consecutive month, while the US PPI was in line with forecasts.
- U.S. NFP beat expectations across the board, although average hourly earnings were in line with forecasts.
- The US ISM Manufacturing PMI significantly exceeded expectations, as the price component continued to rise, while the US ISM Services PMI missed expectations, with the price index falling to a 4-year low.
- U.S. retail sales far exceeded expectations across the board, with positive revisions from previous figures.
- The market now expects a first rate cut in September.
EUR
- The ECB left interest rates unchanged as expected and opened the door to a rate cut in June.
- The recent Eurozone CPI did not meet expectations.
- The labor market remains historically tight, with the unemployment rate at historically low levels.
- The latest Eurozone PMI indices exceeded expectations for services, while that of the manufacturing sector missed a further contraction.
- The market expects the ECB to cut rates in June.
EURUSD Technical Analysis – Daily Timeline
EURUSD Daily
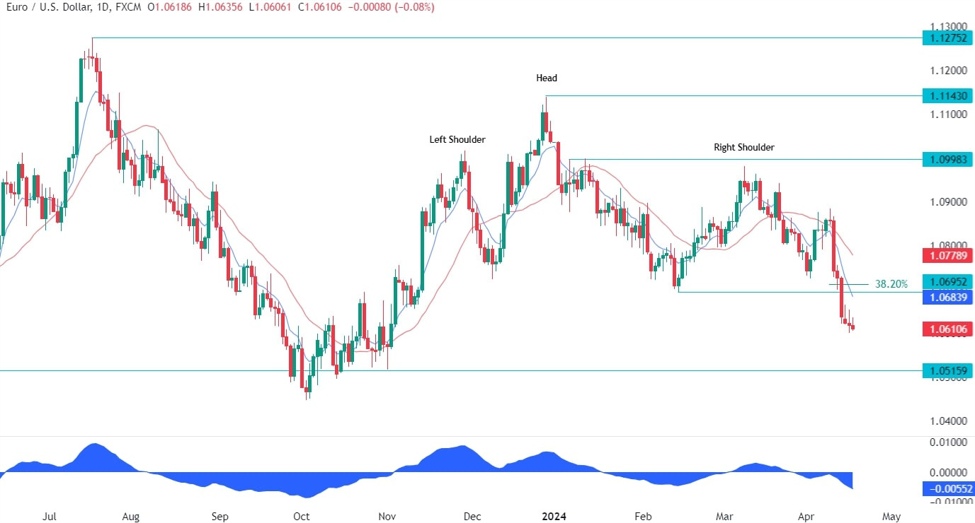
On the daily chart, we can see that EURUSD broke the key support at 1.07 and extended the decline to the 1.06 handle as the divergence between the Fed and ECB strengthened. From a risk management perspective, sellers will have a much better risk to reward setup around the 1.07 handle where they will find the confluence of the 38.2% Fibonacci retracement level and the moving averages. Buyers, on the other hand, will need to break through this resistance zone to start aiming for new highs.
EURUSD Technical Analysis – 4 hour time frame
EURUSD 4 hours
On the 4-hour chart, we can see that the price has started to diverge with the MACD around the 1.06 handle. This is usually a sign of weakening momentum, often followed by pullbacks or reversals. In this case, it could be a signal for a pullback after a sell-off. Buyers could begin to pile in around these levels with risk set below the 1.06 handle to position themselves for a rally towards the 1.07 resistance.
EURUSD Technical Analysis – 1 Hour Timeframe
EURUSD 1 hour
On the hourly chart we can see the divergence with the MACD more clearly and we can also notice that the recent price action has formed what looks like a descending triangle. Price may break either side of the pattern, but what follows next is usually a sustained move in the direction of the breakout. In this case, if we get a breakout to the downside, we can expect sellers to increase their bearish bets and take the pair into the 1.05 handle. On the other hand, if we get a breakout higher, buyers should increase their bullish bets up to the resistance at 1.07.
Events to come
This week, the only notable report remaining is tomorrow’s US jobless claims numbers.
Watch the video below
cnbctv18-forexlive