Last Friday, the Dow sold off at the close as we reduced risk flows across the board due to news of imminent Iranian retaliation. Over the weekend, Iran launched its operation with drones and missiles against Israel, but almost all of them were intercepted and there were no casualties. Ultimately, Iran declared the operation considered complete and we received reports of a general de-escalation, with the United States telling Israel it would not support retaliation. We may see some positive risk sentiment and likely a discrepancy with the economic data that will then be the focus.
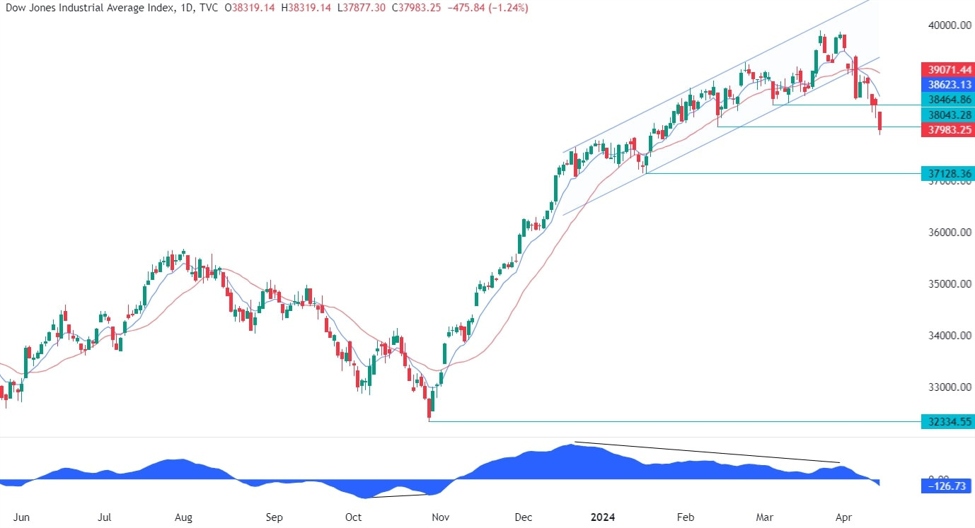
Dow Jones Technical Analysis – Daily Timeline
Dow Jones Daily
On the daily chart, we can see that the Dow Jones is trading in an ascending channel and continues to diverge with the MACD for a long time. This is usually a sign of weakening momentum, often followed by pullbacks or reversals. Recently we had a breakout which opened the door for a larger correction towards the 37128 level. Sellers managed to break the first key support level and will now also aim for a breakout below the second. Buyers, on the other hand, will likely step in here with a defined risk below the level to position themselves for a rally to another all-time high.
Dow Jones Technical Analysis – 4 hour time frame
Dow Jones 4 hours
On the 4-hour chart we can see that price was rejected by the downtrend line and the blue 8 moving average as sellers continued to build on them with risk set above the line trend to position itself at new lows. If we get another pullback, we can expect sellers to again intervene around the trendline to position themselves for a break below the second key support level with a better risk/reward setup. Buyers, on the other hand, will want to see the price rise to invalidate the bearish setup and increase bullish bets to a new all-time high.
Dow Jones Technical Analysis – 1 Hour Time Frame
Dow Jones 1 hour
On the hourly chart, we can see that besides the trendline and the 8 moving average, sellers will also find the 61.8% Fibonacci retracement level, adding an additional confluence around the 38300 level.
Events to come
This week is a bit empty on the data front with only two notable reports. Today we have the retail sales data while on Thursday we will get the latest US jobless claims numbers.
cnbctv18-forexlive