- The ONS data shows how each area has been hit by rising mortgages and rents.
The rising costs of mortgages and rents facing Britons have been laid bare by new data showing how vulnerable each region is to swings in the property market.
The Office for National Statistics (ONS) has compiled figures for every local authority in England and Wales which show just how exposed landlords and tenants are to rising costs.
Data shows London residents were most likely to be hit by rising mortgages and rents, with Kensington and Chelsea topping both lists, with average monthly mortgage payments increasing by £1,193 (30%) , rising from £3,907 to £5,100 from 2022 to 2023. in the borough does not fare much better, with average monthly rents increasing by almost £273 (10%), from £2,757 to £3,030.
But Blaenau Gwent, Wales, saw the smallest rise in mortgage rates, with an average increase of £68 (21%), from £317 to £386 per month.
Housing costs have seen a sharp increase since 2022 amid soaring inflation and higher interest rates. Renters in the area saw an increase of £55 per month (11%), from £484 to £539.
In the year to October 2022, inflation reached its highest level in 40 years, according to the Consumer Price Index, including owner-occupier housing costs. In response, the Bank of England gradually increased the bank rate by 0.1 percent to 5.25 percent between winter 2021 and summer 2023.
More than 1.4 million households in the UK had term mortgages due for renewal in 2023, more than half with interest rates below 2%. By the end of 2023, more than a third of people responsible for paying rent or mortgage in Britain were struggling to pay them, according to an ONS survey.
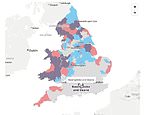
The ONS has created the tool below which explores which areas of England and Wales have been most and least exposed to rising mortgage and rent costs in 2023. The statistics agency assigned each area an exposure score compared to other local authorities based on two measures:
- The estimated proportion of households affected by rising costs.
- The increase in costs as a proportion of the estimated disposable income for the average household.
To use the ONS tool below, select your area below and you will see maps, charts and analysis showing how housing costs would have increased in 2023, as well as a comparison with other areas:
dailymail us