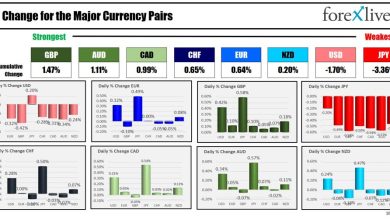
USD
- The Fed left interest rates unchanged as expected at the last meeting, with virtually no change in its statement. The Dot Plot still shows three rate cuts for 2024 and the economic projections have been improved with higher growth and inflation and lower unemployment.
- The US CPI beat expectations for the third consecutive month, while the US PPI was in line with forecasts.
- U.S. NFP beat expectations across the board, although average hourly earnings were in line with forecasts.
- The US ISM Manufacturing PMI significantly exceeded expectations, as the price component continued to rise, while the US ISM Services PMI missed expectations, with the price index falling to a 4-year low.
- U.S. retail sales far exceeded expectations across the board, with positive revisions from previous figures.
- The market now expects a first rate cut in September.
GUJAT
- The Bank of Canada left interest rates unchanged at 5.00%, as expected, changing a line in the release that indicated less concern about inflation and therefore the possibility of a cut in June if the trend remains intact.
- The latest Canadian CPI came in line with expectations, even as underlying inflation measures eased further.
- On the labor market side, the latest report fell short of expectations across the board, although we did see a slight uptick in wage growth, a phenomenon the Bank of Canada is monitoring closely.
- The Canadian manufacturing PMI improved slightly in March, while the services PMI weakened further. Both measures remain in contraction territory.
- The market expects a first rate cut in June.
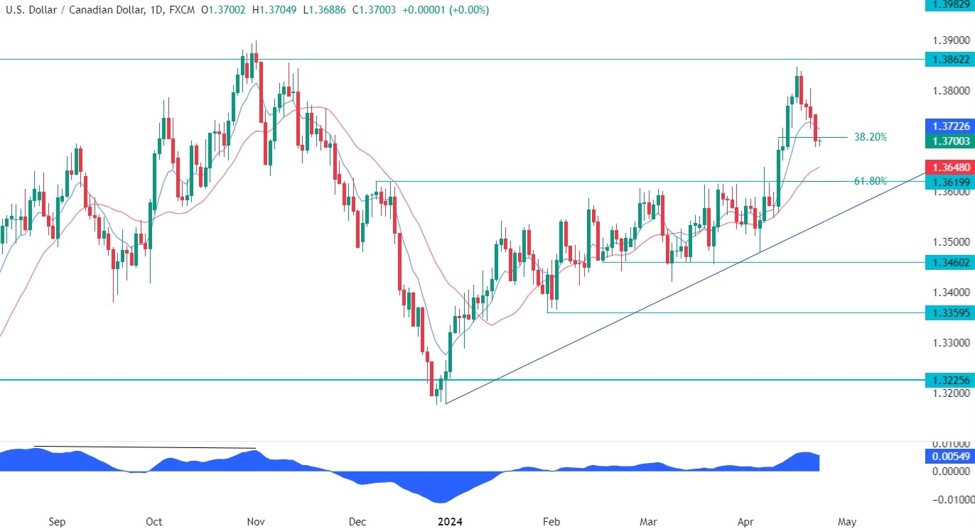
USDCAD Technical Analysis – Daily Timeline
USDCAD Daily
On the daily chart, we can see that USDCAD approached the top of the one-year range around the 1.3862 level, but eventually fell back to the 1.37 handle. We can see that from a risk management perspective, buyers will have a much better risk to reward setup around the 1.3620 level where we can find the confluence of previous resistance turned support and the retracement level of Fibonacci of 61.8%. Sellers, on the other hand, will want to see the price move below the main trendline to reverse the trend and target a decline to the bottom of the range around the 1.3225 level.
USDCAD Technical Analysis – 4 Hour Timeframe
USDCAD 4 hours
On the 4-hour chart we can see that price yesterday fell below the minor uptrend line, making the bias more bearish and opening the door for a decline into the 1.3620 support. We now have a minor downtrend line and the red 21 moving average defining the current bearish momentum. This is where we can expect sellers to step in with risk set above the trendline to position for a decline into 1.3620 support with a better risk/reward setup . Buyers, on the other hand, will want to see the price surge to invalidate the bearish setup and position themselves for a rally to new highs.
USDCAD Technical Analysis – 1 Hour Timeframe
USDCAD 1 hour
On the hourly chart we can see that we also have the Fibonacci retracement levels on this time frame, adding further confluence to the bearish pattern around the trendline. Watch out for US Flash PMI data today as it will be a market-moving event.
Events to come
Today we get the Flash US PMIs. Tomorrow we have Canadian retail sales. On Thursday we will see the latest US jobless claims figures, while on Friday we conclude the week with the US PCE report.
cnbctv18-forexlive