Earlier this week, Australia’s CPI for the quarter came in better than expected, helping to push the AUDUSD pair higher. Price extended up to the 200-day moving average and 200-bar moving average on the 4-hour chart near 0.6530, where sellers leaned in.
The subsequent downward move moves the price towards an oscillating zone between 0.6475 and 0.6486. The price is also listed below its 100-bar moving average on the 4-hour chart and 50% of the midpoint of the April trading range at 0.65028.
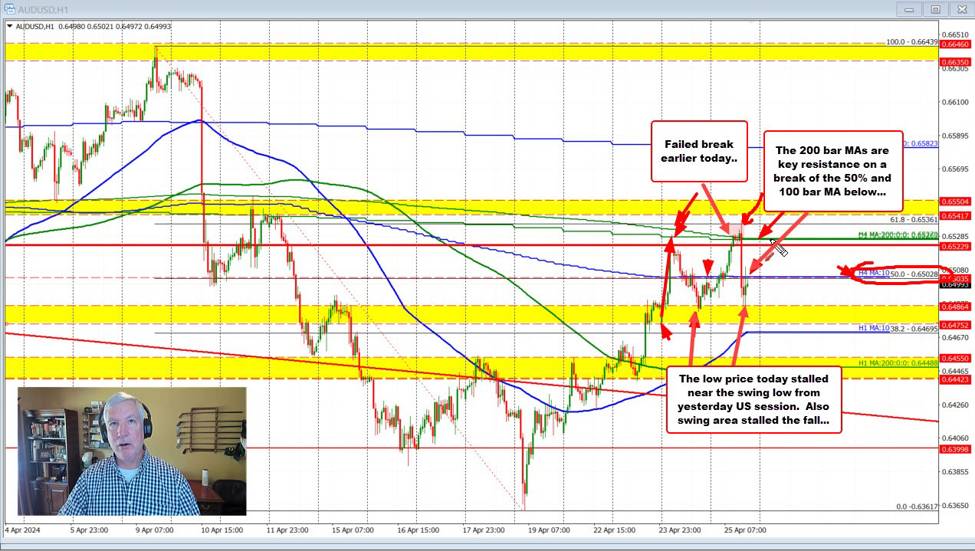
Today, despite the public holidays in Australia and New Zealand, AUDUSD regained its bullish momentum and carried the price safely above its 200-bar moving averages on the upper side.
Then, US inflation took priority, and the pair fell after a higher core PCE in the US GDP report. The price then moved back below the 50% midpoint and the 100-bar moving average at 0.65028. This level now constitutes close resistance for traders and will represent a barometer for buyers and sellers. Staying below is more bearish. Moving above and staying above would be more bullish.
See all the ups and downs of AUDUSD in the video above.
AUDUSD trades with volatile upward and downward price action
cnbctv18-forexlive