Crude oil broke key resistance at $83 following the strong US ISM manufacturing index last week and pulled back early this week as we saw no escalation between Israel and Iran and even had talks on a possible ceasefire between Israel and Iran. Hamas. For now, fundamentals support more upside potential for crude oil as we see a re-acceleration in economic activity and China’s recovery in performance appears to be gaining momentum.
WTI Crude Oil Technical Analysis – Daily Timeline
WTI crude oil per day
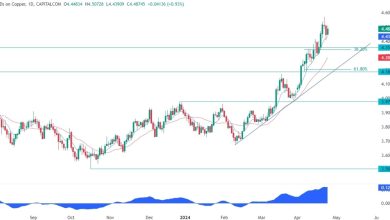
On the daily chart, we can see that crude oil broke the upper boundary of the ascending channel and extended the rally up to the $87.50 level. This breakout should portend further gains to come, with the $90 level being the next target. The price has recently pulled back to retest the broken channel and we can expect buyers to step in around these levels to position themselves for another rally to new highs. Sellers, on the other hand, will want to see the price fall back below key support at $83 to position themselves for a return to the lower boundary of the channel.
WTI Crude Oil Technical Analysis – 4 Hour Time Frame
WTI crude oil 4 hours
On the 4 hour chart we can see that from a risk management perspective, buyers will have a much better risk to reward a setup around the $83 support where we can find the confluence of the red daily moving average 21, the uptrend line and the 61.8% Fibonacci retracement level. Buyers are already using the 38.2% Fibonacci retracement level as support to position themselves towards new highs, but should the price break below, we can expect them to pile up around the support of $83.
WTI Crude Oil Technical Analysis – 1 Hour Time Frame
WTI crude oil 1 hour
On the hourly chart, we can see that the price action after the channel breakout has diverged with the MACD, which is usually a sign of weakening momentum, often followed by pullbacks or reversals. In this case, this should signal a pullback into the trendline, although price has found strong support around the 38.2% Fibonacci retracement level. We found ourselves stuck in a consolidation between the Fibonacci level and the black counter-trend line. A breakout higher should see buyers increase their bullish bets and extend the rally to new highs. On the other hand, a breakout to the downside will see sellers positioning for a break below the $83 support with a better risk/reward setup.
Events to come
Today we receive the US CPI report and the FOMC minutes. Tomorrow we will have the US PPI and the latest US jobless claims figures. On Friday, we wrap up the week with the University of Michigan Consumer Sentiment Survey.
cnbctv18-forexlive