The recent development of crude oil prices indicates that the market needs some rest, as we have not seen a sustainable recovery despite the significant geopolitical risk in the Middle East between Israel and Iran. Overall, fundamentals remain supportive for the market as we see economic activity picking up, even as expectations for rate cuts continue to diminish. It will be important to monitor technical parameters as a decline below the key $83 support zone could begin to signal a reversal in the uptrend.
WTI Crude Oil Technical Analysis – Daily Timeline
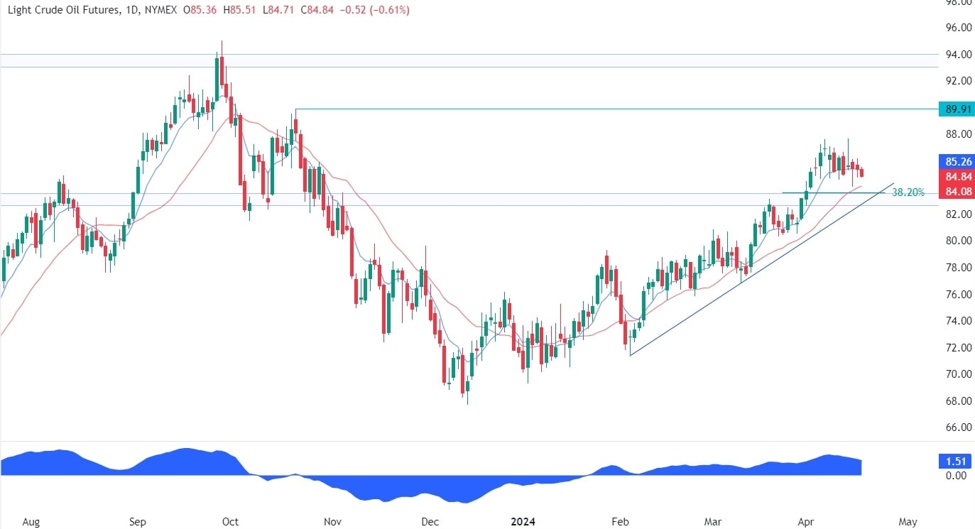
WTI crude oil per day
On the daily chart, we can see that crude oil has recently found itself stuck in a consolidation with a slight downtrend as the price continues to pull back into the key $83 support zone. This is where we can expect buyers to step in as they will also find the confluence of the trendline, the red 21 moving average, and the 38.2% Fibonacci retracement level. Sellers, on the other hand, will want to see the price fall to invalidate the bullish setup and position themselves for a return to the lows.
WTI Crude Oil Technical Analysis – 4 Hour Time Frame
WTI crude oil 4 hours
On the 4-hour chart we can see price breaking below another minor trendline, which should see some sellers piling in to target a drop into the main trendline in preparation for a pullback . There’s not much else we can get from this graph, so we have to zoom in to see more detail.
WTI Crude Oil Technical Analysis – 1 Hour Time Frame
WTI crude oil 1 hour
On the hourly chart we can see more clearly the consolidation taking place since last Monday. We can also see that we have a counter downtrend line where sellers have gathered for better entry to target a decline in the main trendline.
Events to come
Tomorrow we will receive the latest figures for jobless claims in the United States.
cnbctv18-forexlive