Last week, the Nasdaq Composite came under pressure due to geopolitical fears and a general sense of risk aversion. The latest developments have seen Israel retaliate against Iran, but the latter has played down the airstrikes. This episode could be behind our backs, although it would be worth monitoring if it were to become worrying again. On the macro front, the Fed’s rhetoric has become more hawkish, particularly in the latter part of the week, as inflation growth appears to have stalled. Overall, last week saw many bearish catalysts weighing on the market. So we will likely need some positive data on the inflation front this week to reverse the trend.
Nasdaq Composite Technical Analysis – Daily Timeline
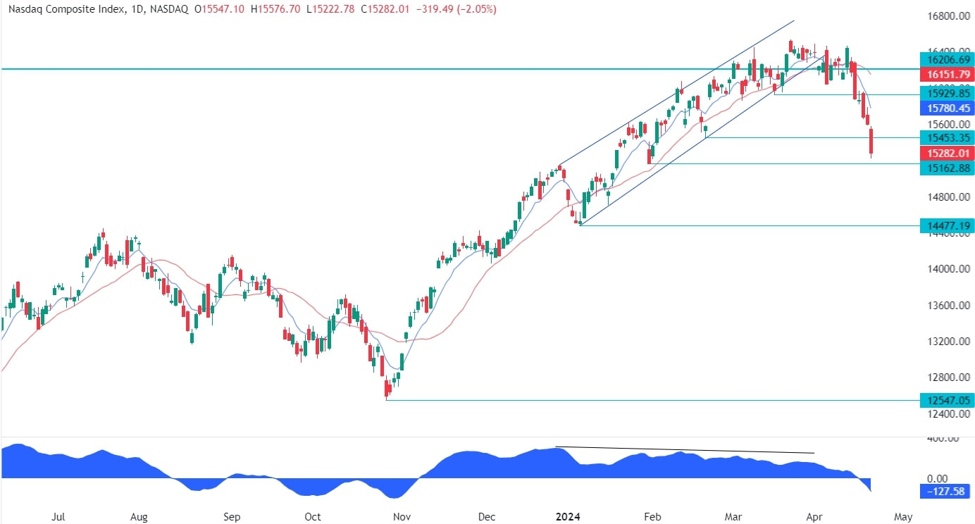
Nasdaq Composite Daily
On the daily chart, we can see that the Nasdaq Composite broke another key level at 15453 and extended the sell-off to support at 15162. We can also notice that the price has been a little overextended, as shown in the distance from the blue moving average 8. In such cases, we can usually see a pullback towards the moving average or some consolidation before the next move. Buyers may begin to accumulate more aggressively around these levels to position themselves for a rally to a new all-time high with a better risk/reward setup. Sellers, on the other hand, will want to see the price fall to increase bearish bets until the next support at 14477.
Nasdaq Composite Technical Analysis – 4 Hour Timeframe
Nasdaq Composite 4 hours
On the 4-hour chart, we can see that the price has also been surpassed over this time frame. Buyers might want to start piling in around these levels or wait for a catalyst which could be either tomorrow’s flash US PMIs or Friday’s US PCE. Sellers should continue to sell the rallies to position for the ultimate target around the 14477 level. There is not much else to take from this chart, so we need to zoom in to see more details.
Nasdaq Composite Technical Analysis – 1 Hour Timeframe
Nasdaq Composite 1 hour
On the hourly chart we can see that we have a trend line defining the current bearish momentum where we can find the red moving average 21 for the confluence. If we get a pullback, we can expect sellers to step in around the trendline with risk set above to position for new lows. Buyers, on the other hand, will want to see the price move higher to accumulate and position themselves for a rally towards the 15929 level.
Events to come
This week is a bit empty on the data front with only a few notable releases. We start tomorrow with the US PMIs. On Thursday we will receive first quarter US GDP and the latest US jobless claims figures. On Friday, we conclude the week with the US PCE report.
cnbctv18-forexlive