A batch of cars is ready for shipment to overseas markets at the port of Taicang, Jiangsu province, China, 9 April 2024.
Future publications | Future publications | Getty Images
Inflation is rising again, but it is not the only economic indicator to rebound. Imports from China to the United States are seeing a notable increase, according to new trade and logistics data.
The increase in containers imported from China to the United States began after manufacturing plants closed during Lunar New Year celebrations reopened. Cargo volume entering the nation’s major container ports is expected to exceed two million units by May for the first time since last fall, according to the Global Port Tracker report released by the National Retail Federation and Hackett Associates. , as imports increase despite the new supply chain. challenges.
The first half of 2024 is expected to total 11.7 million TEUs (twenty-foot equivalent units), an increase of 11% compared to the same period last year. In 2023, imports decreased by almost 13% compared to 2022, for a total of 22.3 million TEUs.
Trade data is a forward-looking indicator of a strong consumption-driven economy, based on merchandise transit orders placed by U.S. retailers and manufacturers.
U.S. imports continue to increase despite multiple supply chain disruptions affecting U.S. ports, noted John Gold, NRF vice president for supply chain and customs policy. Retailers have adapted to limits on use of the Panama Canal resulting from drought, trade diversions caused by Red Sea attacks and, more recently, the closure of the Port of Baltimore to shipping traffic.
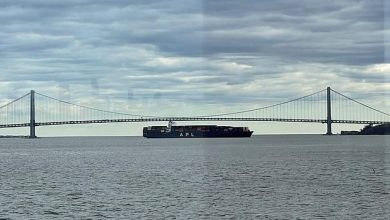
“While not expected to have a national impact, the tragic collapse of the Francis Scott Key Bridge demonstrates the continued need for flexibility and resilience in every company’s supply chain. We are monitoring the situation closely as affected retailers adjust their shipping plans. to ensure goods get where they need to be,” Gold said.
Although an important trading center, particularly for automobiles, trucks and agricultural equipment, the Port of Baltimore is not among the largest container ports on the East Coast, handling 1.1 million TEUs in calendar year 2023. For comparison, New York/New Jersey processed 7.81. million TEUs, Georgia 5.4 million TEUs, Virginia 3.3 million TEUs, Charleston 2.5 million TEUs, Jacksonville 1.3 million TEUs and Miami 1.25 million TEUs.
Nonetheless, port diversions and the general rebound in consumer product imports are impacting supply chain prices, as evidenced by the Port of Virginia (Norfolk), where overall container volume is increasing and are processed the containers from Baltimore.
Data released Wednesday by container trucking directory site Drayage.com shows a slight increase in drayage prices in Norfolk based on demand for the type of truck that moves containers.
“Norfolk is near pandemic levels,” said Jason Hilsenbeck, president of Drayage.com and LoadMatch. “With the sudden increase in containerized freight, Norfolk carriers are charging a premium on freight rates.”
Paul Brashier, vice president of drayage and intermodal at ITS Logistics, told CNBC that in April and May, new ports (mainly NY/NJ and Norfolk) will become the North American entry point for freight from Baltimore. It tracks spikes in demand for service in Norfolk and New York/New Jersey as more shippers seek help moving their containers due to the Baltimore crash.
“This will increase congestion and complicate operations in these locations, and this unanticipated increase in demand will cause trucking rates to rise. The long-term effects could be increased migration of trans-Pacific freight to West Coast ports of North America from the east coast of the United States.” he said.
For rail-bound containers, ITS Logistics’ U.S. Rail and Port Freight Index lifts its warning on West Coast drayage operations and rail ramps to ‘high’ due to increased freight in eastbound entering the ports of Los Angeles and Long. Beach. The combination of increasing the number of containers and the amount of rail chassis available to move the containers is out of balance, creating a lag in the movement of containers.
Brashier said 25 percent of ITS customers’ freight comes back to the ports of Los Angeles and Long Beach.
“Year-on-year, March and April were good, with domestic import volumes up 5-10%,” he said.
Both port directors of Los Angeles and Long Beach recently told CNBC that the increase in eastbound containers heading to their ports was the result of drought-related restrictions in the Panama Canal. The other reason for the recent container surge is fear of a strike at East Coast and Gulf ports. The International Longshoremen’s Association’s six-year contract with the United States Maritime Alliance, which represents East Coast port terminal operators and ocean carriers, expires September 30.
“Due to the continued resilience of the U.S. consumer, 2024 imports have maintained their upward momentum,” said Alan Baer, CEO of OL USA. “We expect this trend to continue, but the magnitude of the year-over-year increase could be challenged by stubborn inflation, coupled with higher long-term interest rates The strength of the US dollar helps support the increased purchasing power of all importers, thereby protecting them to some extent as the cost of capital is higher.
Recent Federal Reserve minutes show central bank officials are concerned that inflation is not falling fast enough, although they still expect to cut interest rates this year.
Although the main contributor to the latest rise in inflation was services, including auto insurance and real estate prices, several categories of goods rose more than expected, including women’s clothing and jewelry. Goods disinflation since the pandemic boom helped the Fed achieve its goal of lower prices, but now the ability of goods prices to contribute to disinflation is increasingly limited, economist Sarah House told CNBC on Wednesday. principal at Wells Fargo Economics.
According to S&P Global Market Intelligence, U.S. maritime imports in March were strong, with containerized freight shipments increasing 16% year over year. The expansion follows two months of rapid growth in January and February, which brought the first quarter 2024 total to growth of 15%, according to Chris Rogers, head of supply chain research at S&P Global.
“Some caution is warranted, however, as the growth rate is based on a previous year, in which companies across various industries were rapidly reducing inventories,” Rogers wrote in an email.
On a compound annual basis, shipments have increased 3.5% over the past five years. Year over year, S&P data shows the fastest growth rates were in the materials sector, with an increase of 20%, as well as the paper and forest products sector, which experienced an increase of 25%. Chemicals and metals increased by 15% and 17%, respectively.
cnbc