USD
- The Fed left interest rates unchanged as expected at the last meeting, with virtually no change in its statement. The Dot Plot showed three more rate cuts for 2024 and the economic projections were improved with higher growth and inflation and lower unemployment.
- The US CPI beat expectations for the third consecutive month, while the US PPI was in line with forecasts.
- U.S. NFP beat expectations across the board, although average hourly earnings were in line with forecasts.
- The US ISM Manufacturing PMI significantly exceeded expectations, as the price component continued to rise, while the US ISM Services PMI missed expectations, with the price index falling to a 4-year low.
- U.S. retail sales far exceeded expectations across the board, with positive revisions from previous figures.
- The market now expects a first rate cut in September.
GBP
- The BoE left interest rates unchanged as expected, but Haskel and Mann this time voted for a hold rather than an increase.
- The jobs report fell short of expectations with the unemployment rate rising sharply although wage growth increased.
- UK CPI beat expectations with services inflation remaining stable, continuing to support the BoE’s patient stance.
- The latest UK PMIs showed that the Services PMI was slightly below expectations and the Manufacturing PMI was above expectations.
- The market expects a first rate cut in August.
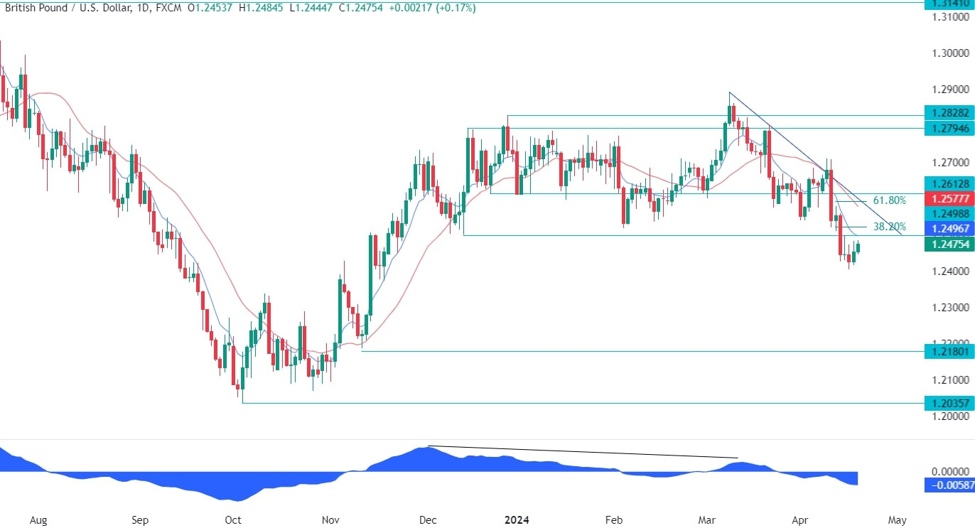
GBPUSD Technical Analysis – Daily Timeline
GBPUSD Daily
On the daily chart, we can see that GBPUSD is returning to some key resistance levels with even a possible breakout and retest around the 1.25 handle. In fact, we can see that sellers will have two short opportunities:
- The first around the 1.25 handle where they will also find the confluence of the 38.2% Fibonacci retracement level and the blue 8 moving average.
- The second around the 1.26 handle where they will find the confluence of the trend line, the 61.8% Fibonacci retracement level and the red 21 moving average.
Buyers, on the other hand, will need to cross the trend line to reverse the trend and start aiming for a new cycle high.
GBPUSD Technical Analysis – 4 Hour Timeframe
GBPUSD 4 hours
On the 4-hour chart, we can see the bearish setups around the 1.25 and 1.26 handles more clearly. If price were to break above the 1.25 resistance zone, we can expect buyers to increase their bullish bets within the trendline aiming for a breakout above it. There’s not much else to take from this chart, so we have to zoom in to see more detail.
GBPUSD Technical Analysis – 1 Hour Timeframe
GBPUSD 1 hour
On the hourly chart, we can see that price has diverged with the MACD, which is usually a sign of weakening momentum, often followed by pullbacks or reversals. In this case, the ultimate target for the pullback should be the base of the divergent formation around the 1.26 handle with a break above confirming a reversal. In case we get a rejection of the 1.25 resistance, buyers could rely on the black counter-trend line to position themselves for a rally towards the main trend line. Sellers, on the other hand, will want to see the price fall to increase bearish bets to new lows.
Events to come
Today we receive the latest US jobless claims figures, while tomorrow we wrap up the week with UK retail sales.
cnbctv18-forexlive