USD
- The Fed left interest rates unchanged as expected at the last meeting, with virtually no change in its statement. The Dot Plot showed three more rate cuts for 2024 and the economic projections were improved with higher growth and inflation and lower unemployment.
- Fed Chairman Powell maintained a neutral stance, saying it was premature to react to recent inflation data given possible obstacles on the path to their 2% target.
- The US CPI and PPI exceeded expectations for the second month in a row.
- U.S. NFP beat expectations across the board, although average hourly earnings were in line with forecasts.
- The US ISM Manufacturing PMI significantly beat expectations as the price component continued to rise, while the US ISM Services PMI missed expectations as the price index fell to a 4-year low .
- There is now a 50/50 chance of a rate cut in June.
EUR
- The ECB left interest rates unchanged as expected at the last meeting, revising downward inflation and growth expectations and maintaining the usual data-dependent language.
- The recent Eurozone CPI did not meet expectations.
- The labor market remains historically tight, with the unemployment rate at historically low levels.
- The latest Eurozone PMI indices exceeded expectations for services, while that of the manufacturing sector missed a further contraction.
- The market expects the ECB to cut rates in June.
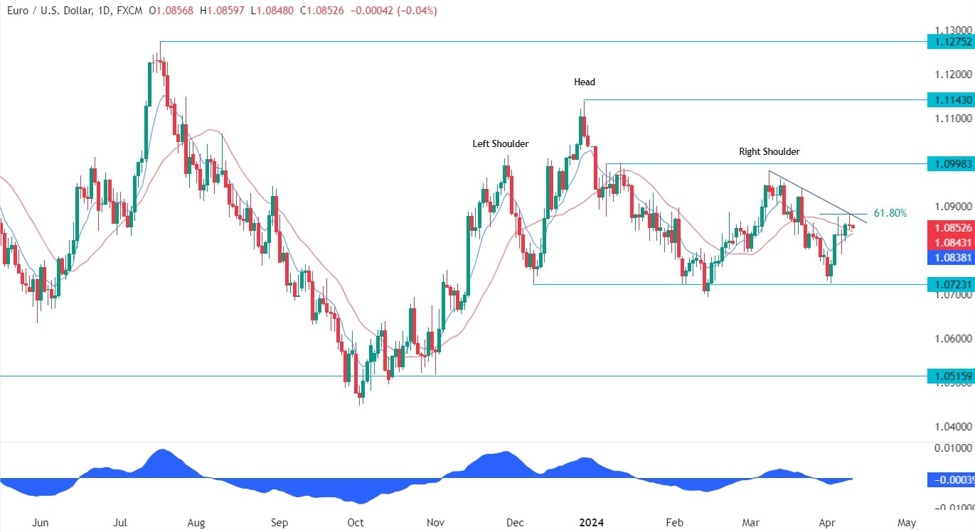
EURUSD Technical Analysis – Daily Timeline
EURUSD Daily
On the daily chart we can see that EURUSD was recently rejected by the trendline where we can also find the confluence of the 61.8% Fibonacci retracement level and the red 21 moving average. This is a very strong resistance zone that buyers will need to break to increase bullish bets to the 1.10 handle. Sellers, on the other hand, are expected to pile in around these levels to position themselves for a fall to new lows, aiming for a break below the key level of 1.0723.
EURUSD Technical Analysis – 4 hour time frame
EURUSD 4 hours
On the 4-hour chart we can take a closer look at the resistance zone around the 1.0870 level and we can also notice that the last bullish leg has diverged with the MACD. This is usually a sign of weakening momentum, often followed by pullbacks or reversals. In this case, it could be another bearish signal, although the price will need to move below the uptrend line to confirm it.
EURUSD Technical Analysis – 1 Hour Timeframe
EURUSD 1 hour
On the hourly chart we can see that we have a support zone around the 1.00845 level where we can also find the confluence of the uptrend line and the 4-hour moving average 21. This is where we We can expect buyers to step in with defined risk below the support zone to position themselves for a rally to new highs. Sellers, on the other hand, will want to see the price fall to increase bearish bets to new lows.
Events to come
Today we receive the US CPI report and the FOMC minutes. Tomorrow we will have the decision on ECB rates, the US PPI and the latest US jobless claims figures. On Friday, we wrap up the week with the University of Michigan Consumer Sentiment Survey.
Watch the video below
cnbctv18-forexlive