- Ethereum (ETH) appeared to form a bullish W pattern on the weekly chart
- Altcoin’s market value to realized value (MVRV) ratio highlighted its fair valuation
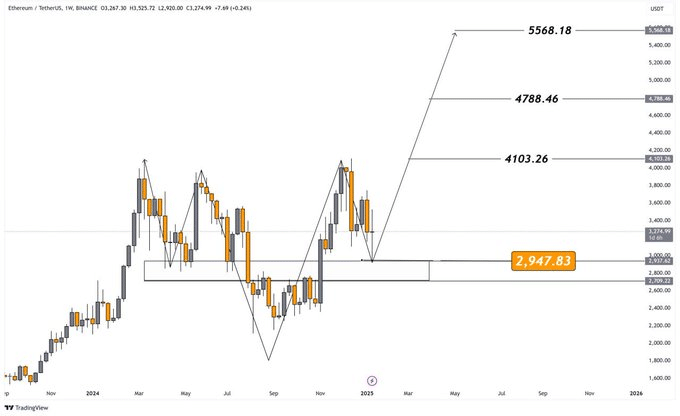
Ethereum (ETH), at the time of writing, formed a bullish W pattern on the weekly chart, signaling a potential trend reversal and significant upside. In fact, the altcoin appeared to be holding above critical support at $2,947 – a level that now serves as the neckline for this formation.
This support zone is key in determining Ethereum’s trajectory, with price targets set at $4,103, $4,788, and $5,568, as highlighted in the chart. A break above the neck resistance would confirm the uptrend, opening the door to significant gains.


Source: TradingView
This W-pattern can be interpreted as highlighting the resilience of Ethereum, highlighting the shift from bearish to bullish momentum. In fact, the altcoin’s price chart revealed that maintaining support above $2,947 would be crucial for this pattern to come to fruition.
A confirmed breakout above $3,200 could pave the way for a quick upward move towards the $4,100 resistance.
Gauging Ethereum’s Momentum
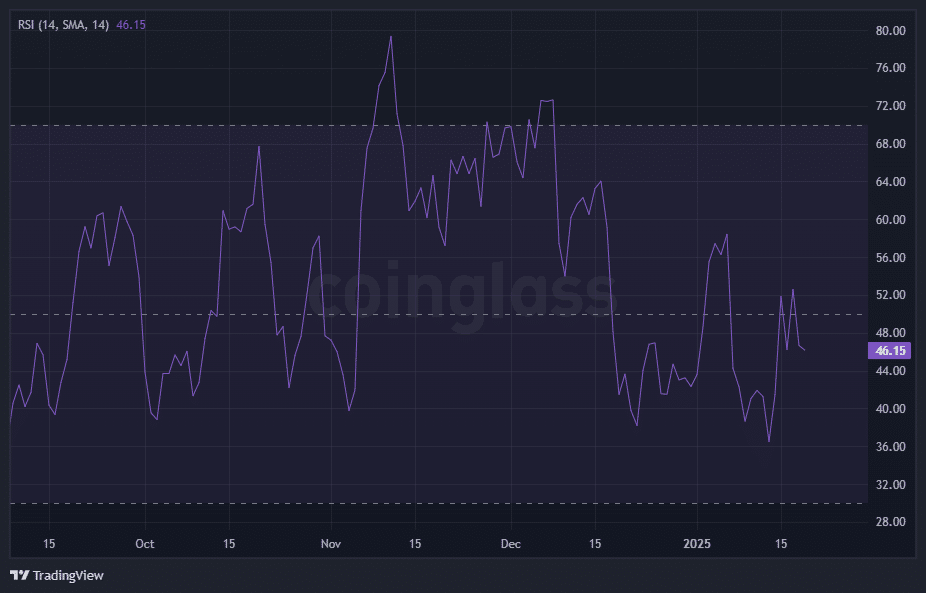
From a momentum perspective, the Relative Strength Index (RSI) had a reading of 46.15 at press time. This neutral level hints at a balance between buyers and sellers in the altcoin market.


Source: Coinglass
However, the stabilization of the RSI near its midline suggests a decline in bearish pressure. A decisive move above 50 could signal renewed bullish momentum, aligning with a possible price breakout.
Conversely, a fall below 40 could be a sign of further decline, putting the $2,947 support level at risk.
Evaluating Ethereum Valuation
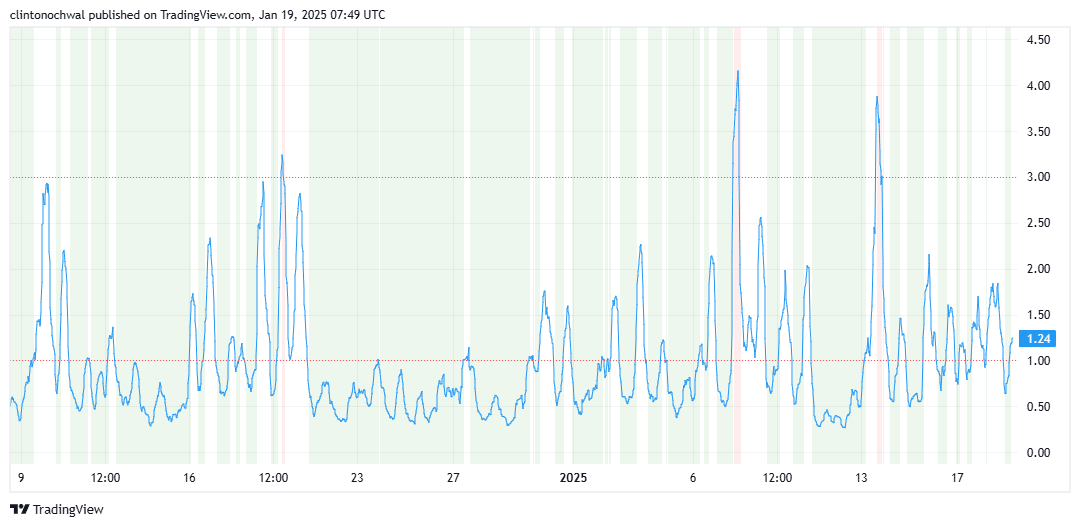
For more information, it’s also worth looking at Ethereum’s market value to realized value (MVRV) ratio. At the time of writing this reading reflected a fair assessment. The ratio was hovering near its neutral levels – a sign that ETH was neither overvalued nor undervalued.


Source: TradingView
Historically, MVRV values above 1.2 have triggered some selling pressure, while values below 0.8 have attracted buyers. As ETH approaches higher targets, the ratio could enter the overvalued zone, prompting caution from long-term investors.
Finally, the long/short ratio revealed that 84.94% of accounts were long – a sign of strong bullish sentiment for Ethereum.


Source: Coinglass
This elevated imbalance hints at potential upward price momentum as buyers have dominated the market thus far. However, overly large long positions can also introduce a risk of sharp price corrections. Especially if market sentiment changes or long sell-offs occur during volatility.
Ethereum’s weekly chart and technical indicators hinted at a pivotal moment for the cryptocurrency. The W pattern, combined with a neutral RSI and a balanced MVRV ratio, highlighted Ethereum’s potential for a bullish breakout if key levels hold.


